Responding to Climate Change
—Governance, Risk Management, Goals and Performance
The Nippon Steel Group recognizes that climate change is an important issue that affects the survival of humankind, and that it may have a serious impact on the business environment and business performance. In order to conduct business in a sustained manner, we are working to reduce the impact of climate change through initiatives to reduce CO2 emissions throughout the supply chain.
Governance concerning climate change
Nippon Steel recognizes climate change as one of its important managerial issues. We have established the Green Transformation Promotion Committee and the Environmental Planning Committee at the Board of Directors level because this issue may have an significant impact on the business environment and management. These two committees set strategies, risk management policies, annual budgets, business plans, and performance targets related to climate-related issues, as well as deliberate and supervise their progress.
Among the matters discussed, decided, and reported by the Committees, significant matters are resolved and reported at the Board of Directors.
Management of climate-related risks
Recognizing external climate-related risks and opportunities, we identify risks and opportunities that could have a significant impact on our business in terms of impact on upstream procurement, direct operations, and downstream provision of products and services for each transition factor and physical factor.
Specifically, from the perspectives of markets, policies, laws and regulations, technology, and reputation, we identify transition risks, physical risks, and opportunities that could affect upstream procurement, direct operations, and downstream provision of products and services. We then identify significant risks based on the likelihood of occurrence and magnitude of impact of those risks and opportunities.
The identified risks and opportunities are reported to the Board of Directors level committees as stated on the left, and significant risks are reported to the Board of Directors. These risks are thereby integrated into the Company’s overall risk management.
The Group’s CO2 emissions reduction target
Nippon Steel has set its CO2 emission reduction targets under the Nippon Steel Carbon Neutral Vision 2050, aiming to reduce total CO2 emissions by 30% from 2013 levels by 2030 and achieve carbon neutrality by 2050.
In addition, the Nippon Steel Group including consolidated crude steelmaking companies that have blast furnaces and electric furnaces with high CO2 emissions have set a target for 30% reduction in CO2 emissions in 2030 compared to 2013. Also, our major domestic consolidated subsidiaries aim to be carbon neutral in 2050. Our overall Group will work together to tackle climate change issues.
Furthermore, the Company will continue to timely and flexibly work on the matter of how to deal with the scope of setting CO2 emission reduction targets (such as covered subsidiaries and affiliates) as it conducts business in Japan and overseas, in light of, among others, international trends in climate change measures and trends in laws, systems, and disclosure standards in each country.
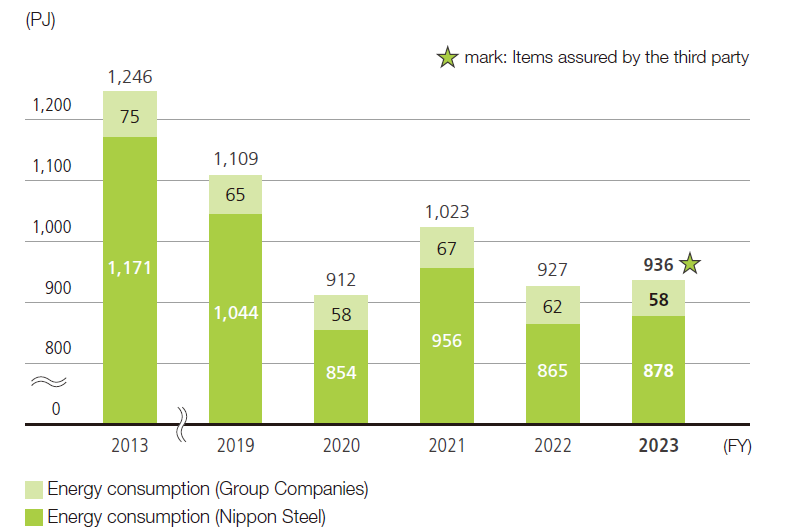
Nippon Steel Group’s energy consumption and energy-derived CO2 emissions
Nippon Steel has been working on energy conservation from diverse starting points: improving efficient use of energy generated in the steelmaking process (i.e., power generation from recovered by-product gas and waste heat); making operational improvements in each process; renovation of older coke ovens and other equipment; introduction of high-efficiency power generation facilities and oxygen plants; and conversion to regenerative burners in the reheating furnaces.
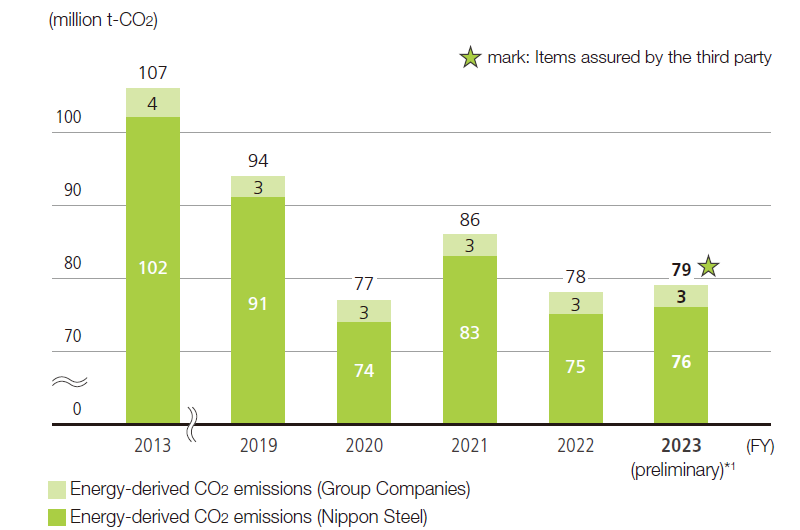
In fiscal 2023, when production slightly increased, energy-saving measures were also addressed. As a result, our energy consumption and energy-derived CO2 emissions were 936 petajoules (PJ) and 79 million t-CO2 (a preliminary figure). Our energy-derived CO2 emissions accounted for 96% of our GHG emissions.
Energy consumption
Energy-derived CO2 emissions
[Boundary of data collection]
Nippon Steel*2, *3, associated EAF mills (Osaka Steel, Sanyo Special Steel, Nippon Steel Stainless Steel, Oji Steel, Tokai Special Steel, Nippon Steel Structural Shapes Corporation, Tokyo Kohtetsu, Ovako, Sanyo Special Steel Manufacturing India, and Standard Steel), and three Sanso Center companies*4
The data collection period used is each company’s accounting period. As Ovako has changed its fiscal year end, Ovako’s fiscal 2021 results cover a period from January 1, 2021 to March 31, 2022 (15 months).
[Calculation method]
Calculation for the Company and its domestic subsidiaries is based on the methodology of the Carbon Neutrality Action Plan.
Overseas subsidiaries follow local regulations or guidelines for calculation.
[Conversion factor]
The Company and its domestic subsidiaries use the “Table of heat generation and carbon emission coefficient by energy source” (revised January 31, 2020) of the Agency for Natural Resources and Energy, METI.
Overseas subsidiaries use relevant emission factors according to local regulations or guidelines.
1 Preliminary figure: The amount of CO2 per unit of purchased electricity from each of the general power companies in Japan in fiscal 2023 is assumed to be the same amount as in fiscal 2022.
2 Excluding energy consumption and CO2 emission associated with the IPP operation by the steelworks
3 The amounts of energy consumption required for production of coke purchased by Nippon Steel and CO2 emissions are included in the aggregate.
4 Concerning the three Sanso Center companies, the amount of energy consumption required for production of oxygen purchased by Nippon Steel Group and CO2 emissions are included in the aggregate.
Breakdown of greenhouse gas (tons)
*If you are viewing this document on a smartphone, swipe to the sides to flip the pages.
| FY2019 | FY2020 | FY2021 | FY2022 | FY2023 | ||
|---|---|---|---|---|---|---|
| CO2 emissions from energy sources | 90,913,816 | 73,950,499 | 83,241,897 | 74,829,684 | 76,322,383 | |
| CO2 emissions from non-energy sources | 3,234,831 | 2,977,505 | 3,383,493 | 3,079,737 | 3,280,301 | |
| CH4 | 110,431 | 97,086 | 108,578 | 99,093 | 104,975 | |
| N2O | 140,126 | 129,234 | 140,507 | 118,071 | 154,155 | |
| CO2 emissions from non-energy sources Total | 3,485,388 | 3,203,825 | 3,632,578 | 3,296,901 | 3,539,431 | |
| Ratio of CO2 emissions from energy sources to GHG | 96% | 96% | 96% | 96% | 96% | |
CO2 emissions in the value chain
CO2 emissions originated from energy source and generated in Nippon Steel’s manufacturing process (Scope 1 and Scope 2) as well as CO2 emissions in the value chain (Scope 3), which are calculated by using the Green Value Chain Platform of the Ministry of the Environment and other methods are as follows.
*If you are viewing this document on a smartphone, swipe to the sides to flip the pages.
Scope1 and 2
| CO2 emissions (thousand tons-CO2) | Calculation method | ||||||
|---|---|---|---|---|---|---|---|
| FY2013 | FY2019 | FY2020 | FY2021 | FY2022 | FY2023 | ||
| Scope 1 Direct emissions from owned sources associated with use of fuel | 89,578 | 78,6933 | 63,1703 | 71,3113 | 63,4023 | 64,007 | Based on the Carbon Neutrality Action Plan. See the boundary of dxata collection stated on the right. |
| Scope 2 Indirect emissions from the generation of purchased energy | 13,825 | 12,1003 | 11,035 | 12,4583 | 11,9131 | 12,466 | |
| Scope1+2 (Energy consumption per ton of crude steel: t–CO2/t) |
103,403 1.89 |
90,7933 1.93 |
74,2053 1.97 |
83,7683 1.88 |
75,3091 1.92 |
76,472 1.93 |
|
| Crude steel production4 (consolidated-base, 10,000 tons) | 5,474 | 4,709 | 3,766 | 4,445 | 3,913 | 3,951 | |
[Boundary of data collection]
Nippon Steel*2 and associated EAF mills (Osaka Steel, Sanyo Special Steel, Nippon Steel Stainless Steel, Oji Steel, Tokai Special Steel, Tokyo Kohtetsu, Nippon Steel Structural Shapes Corporation, Ovako, Sanyo Special Steel Manufacturing India, and Standard Steel). The data collection period used is each company’s accounting period. As Ovako has changed its fiscal year end, Ovako’s fiscal 2021 results cover a period from January 1, 2021 to March 31, 2022 (15 months).
1 Preliminary figure: The amount of CO2 per unit of purchased electricity from each of the general power companies in Japan in fiscal 2023 is assumed to be the same amount as in fiscal 2022.
2 Excluding CO2 emission associated with the IPP operation by the steelworks.
3 Due to a review of the summary values and changes in coefficients and other factors, the figure for this past year was revised retroactively.
4 This does not include G/GJsteel.
[Conversion factor]
The Company*2 and its domestic subsidiaries use the “Table of heat generation and carbon emission coefficient by energy source” (revised January 31, 2020) of the Agency for Natural Resources and Energy, METI.
Overseas subsidiaries use relevant emission factors according to local rules or guidelines.
Scope 3 All indirect emissions (not included in Scope 2) that occur in the value chain of the reporting company
| CO2 emissions (thousand tons-CO2) | Calculation method | |||
|---|---|---|---|---|
| FY2021 | FY2022 | FY2023 | ||
| ①Purchased goods and services | 15,994 | 12,939 | 11,995 | Calculated using method5 on the right for purchased iron ore, coking coal, coke, and oxygen |
| ②Capital goods | 1,400 | 1,503 | 1,571 | [Amount of capital expenditures] X [Emission factor] |
| ③Fuel and energy related activities not included in Scope 1 or 2 | 338 | 293 | 257 | [Amount of electric power procured and fuel used] X [Emission factor] |
| ④Upstream Transportation and Distribution | 710 | 638 | 611 | [Transportation distance reported in the Energy Saving Law document] X [Emission factor] |
| ⑤Waste generated in operations | 5 | 5 | 5 | [Amount of waste] X [Emission factor] |
| ⑥Business travel | 4 | 4 | 4 | [Number of employees] X [Emission factor] |
| ⑦Employee commuting | 14 | 13 | 13 | [Number of employees] X [Emission factor] |
| ⑮Investments | 1,053 | 1,193 | 1,124 | [Emissions by subsidiaries and affiliates that emit GHG of over 10,000 tons] X [Equity stake of each company] |
[Boundary of data collection] Nippon Steel
5 Iron ore and coal: [Amount purchased of procured iron ore and coal] X [Emission factor]
Coke: [Amount purchased of procured coal at source] X [Emission factor] + [Amount of energy used in production of coke] X [Emission factor by energy source]
Oxygen: [Amount of energy used in production of oxygen] X [Emission factor by energy source]
In FY2022, due to partial changes in the source of emission intensity, CO2 emissions decreased compared to FY2021.
If we use the same emissions factor as in FY2021, CO2 emissions in FY2022 would be 14,619 thousand t-CO2.
[Source of emission factor]
“Emissions unit value database for accounting of greenhouse gas emissions throughout the supply chain (ver. 3.4)” (March 2024, Ministry of the Environment)
“Table of heat generation and carbon emission coefficient by energy source” (Revised January 31, 2020; METI, Agency for Natural Resources and Energy)
CO2 emission reduction by manufacturing Blast furnace cement
By using blast furnace slag for cement production, we are able to reduce the amount of lime and fuel required, and reduce CO2 emissions per ton of cement by 320 kg (more than 40% reduction compared to ordinary cement).
CO2 emissions from cement production
*If you are viewing this document on a smartphone, swipe to the sides to flip the pages.
| 2015 | 2016 | 2017 | 2018 | 2019 | 2020 | 2021 | 2022 | |
|---|---|---|---|---|---|---|---|---|
| Cement production (1,000 tons) | 221 | 208 | 216 | 218 | 207 | 199 | 186 | 191 |
| Cement production capacity (1,000 tons) | 335 | 335 | 335 | 355 | 335 | 335 | 335 | 335 |
| Clinker production (1,000 tons) | 134 | 130 | 136 | 131 | 130 | 125 | 120 | 115 |
| Clinker production capacity (1,000 tons) | 163 | 163 | 142 | 142 | 140 | 140 | 140 | 140 |
| Clinker / cement ratio | 0.61 | 0.63 | 0.63 | 0.60 | 0.63 | 0.63 | 0.64 | 0.60 |
| 2015 | 2016 | 2017 | 2018 | 2019 | 2020 | 2021 | 2022 | |
|---|---|---|---|---|---|---|---|---|
| CO2 emissions(1,000 t-CO2) | 122 | 118 | 122 | 117 | 117 | 110 | 105 | 107 |
| CO2 emission per ton of cement(kg-co2/ton) | 552 | 567 | 564 | 536 | 563 | 555 | 561 | 561 |
Climate change measures in the resource recycling and biodiversity fields —Blue carbon
Nippon Steel has promoted scientific analysis on usefulness and safety of use of steel slag — a by-product from the steelmaking process. To improve this technology, we began a basic study on blue carbon (CO2 absorption and fixation in the marine ecosystem), which is getting more attention as a measure against climate change.
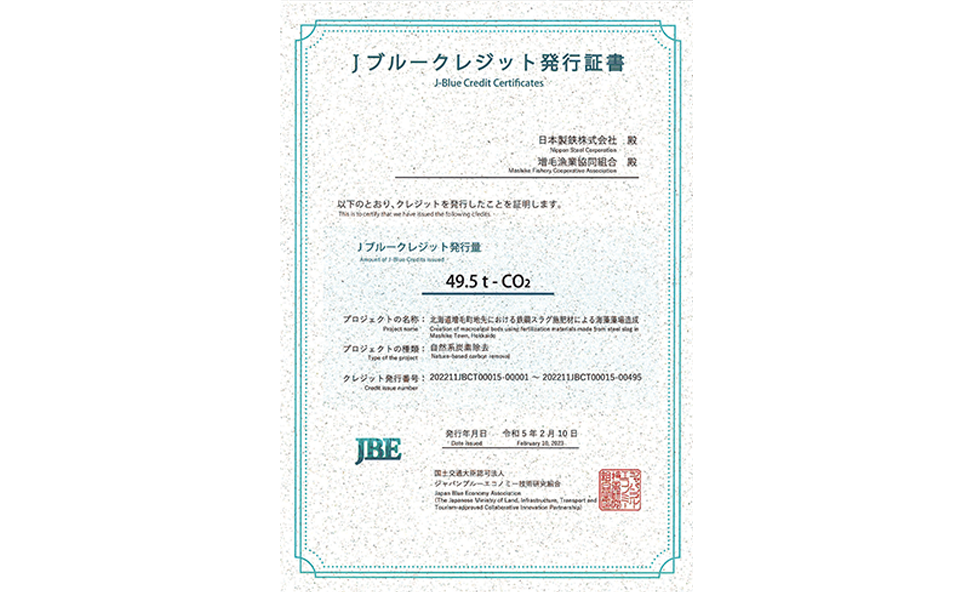
In fiscal 2022, we calculated the CO2 fixation effect in a seaweed bed creation project, on which we have been working over the past nearly 20 years, applying for J-Blue Credit™ certification jointly with the Mashike Fishery Cooperative Association (Mashike, Hokkaido). J-Blue CreditTM was certified and issued for 49.5 t-CO2 — the amount of CO2 absorbed and fixed (blue carbon) over the five years (2018 – 2022).
Further, in fiscal 2023, we submitted applications with joint applicants in Mashike-cho and Tomari-mura in Hokkaido, as well as in Kimitsucity, Chiba Prefecture, and J-Blue CreditTM for 33.3 t-CO2 were certified and issued.
Also in fiscal 2023, we started the new demonstration test of seaweed bed development in 21 sea areas nationwide, and we are conducting continuous surveys of changes in the concentration of iron in seawater before and after the test, as well as the growth of seaweed. In addition to the acquisition of these basic data, we are working to advance seaweed bed development technology by providing theoretical support through scientific approaches, such as off-line testing using the “Sea Laboratory” (marine environment simulator) at the Research & Engineering Center of the R&D Laboratories (Futtsu City, Chiba Prefecture) and model analysis that reproduces actual sea conditions.
We will continue these initiatives utilizing our technologies, and expanding seaweed bed development activities nationwide so as to contribute to the reduction of CO2 emissions through blue carbon.
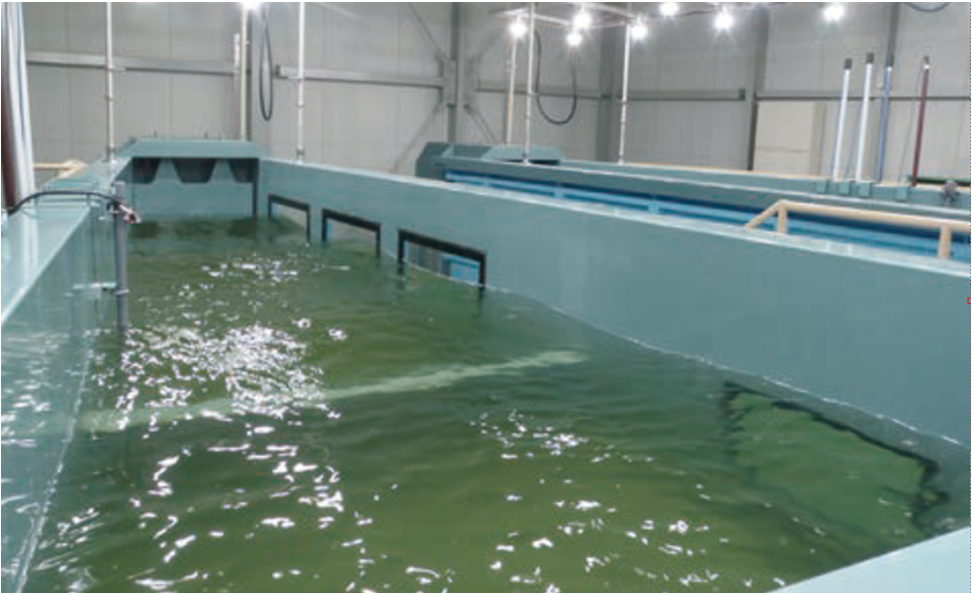
Large water tank Sea Laboratory
Adaptation to climate change
In addition to taking mitigation actions against climate change, we take into account the diverse impact of climate change and appropriately prepare for risks, as adaptive initiatives, and at the same time seek to capture business opportunities.
Preparation for risks
There is a risk that operations and shipments may be interrupted due to the flooding of steelworks and other events, including some caused by abnormal weather as a consequence of climate change. To prevent such risks, we are implementing measures against typhoons and heavy rains, measures to prevent crane overturn, installation of levees, reinforcement of embankments and gradients, and measures to prevent wind and flood damage at each steelworks.
Moreover, our steelworks have enhanced facilities to prevent water pollution. These facilities were provided to increase waste water treatment capacity and involved installation of a large storage tank so that water tainted with iron ore powder would not directly be released into the sea even if our steelworks were subjected to localized heavy rain.
In addition, some administration offices are built on a piloti structure, which means there is open space with no walls on the ground level. This makes the buildings less vulnerable to tsunami. This is a part of our efforts to be well prepared for emergencies such as flooding and high waves.
Capturing business opportunities
We have many products that are used for a long time as construction material for embankments and other public infrastructure. They contribute to providing solutions for “national resilience,” such as protecting towns from flooding or high tides caused by heavy rains or typhoons. Adaptation to climate changes also leads to business opportunities for Nippon Steel.
For example, we have developed and provided for actual use various types of products and product utilization technologies in the civil engineering field. They include hat-type sheet piles (contributing to national resilience in a wide range of ways, including measures against liquefaction of river levees, water leakage, and tsunami reaching coastal levee), linear-type steel piles (having a high-tensile strength at the joints, being suitable to cell-type quays, erosion-control dams and water shut-off work, and contributing to measures for sand embankments and against landslide at the time of heavy rain or a typhoon), and a method of preventing subsidence by use of sheet piles.